

Spatial monitoring from 2024–2026 revealed carbon, temperature, and precipitation signals across Nepal and the Himalayan region raising an urgent question: are we acting fast enough on what science can already see?
By Arun Lama, Environmental Engineer: CEO, Nepal Bioscience Research Laboratory, Kathmandu, Nepal
The catastrophic Rasuwa–Bhotekoshi disaster of 26 August 2026 has become a tragedy that extends across the Nepal- China Himalayan border. According to the latest publicly reported figures, Nepal had recorded 788 deaths, with 2,502 people still missing, as of Sunday evening, according to the National Disaster Risk Reduction and Management Authority. On the Chinese side, authorities reported 16 confirmed deaths and 546 people missing at Gyirong Port in Xizang (Tibet). Together, this represents at least 804 confirmed deaths and 3,048 people still unaccounted for across Nepal and China, although these figures remain fluid as search, recovery and identification operations continue.
These are not merely statistics. Behind every number is a family waiting for someone to return. The extraordinary human toll has placed Rasuwa, Bhotekoshi and the wider Himalayan cryosphere at the centre of national and international discussion about global warming, glacier instability and our capacity to detect environmental risk before catastrophe occurs.
Today, more than 800 people are confirmed dead across Nepal and China, and more than 3,000 remain missing based on the latest available figures. That human cost should transform the way we think about environmental monitoring..
The event also demonstrates how rapidly a high-mountain disturbance can become a transboundary disaster. Chinese scientific investigators reported that an ice-rock avalanche associated with a high-altitude glacier collapse developed into a massive debris flow that travelled roughly 22 kilometres before reaching Gyirong Port. In Nepal, the destructive flow propagated through the Bhotekoshi–Trishuli river system, affecting communities and infrastructure far downstream.
Yet the question for environmental science should not begin only after such destruction occurs. What signals were already visible before the catastrophe?
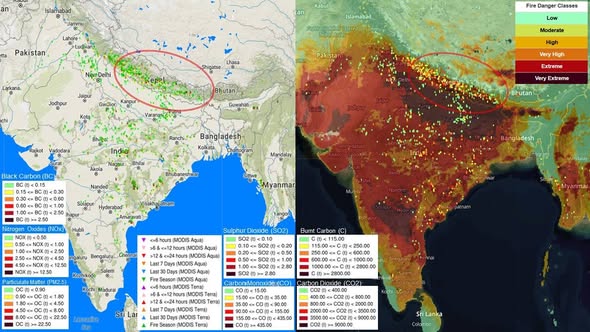
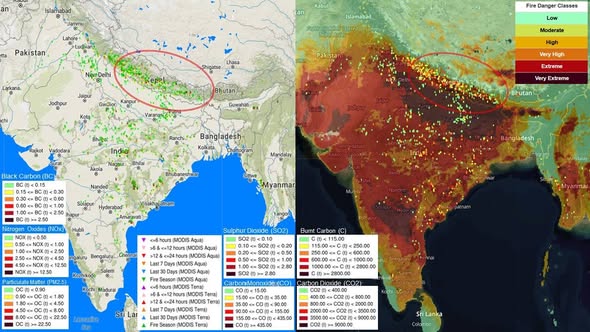
Figure 1. Carbon and Atmospheric Pressure Across Nepal and the Himalayan Region — April–July 2024
Spatial visualization of black carbon (BC), PM₂.₅, NOₓ, SO₂, CO, burned carbon and CO₂ together with satellite-observed fire activity and regional atmospheric conditions. Source: Global Wildfire Information System (GWIS), European Commission Joint Research Centre (JRC); MODIS observations and GWIS emission layers. Spatial visualization compiled and monitored by NBRL, April–July 2024.
The first image is particularly important. During April–July 2024, nearly two years before the Rasuwa catastrophe, NBRL compiled and monitored spatial information from GWIS/JRC and MODIS datasets, focusing particularly on Nepal and its surrounding Himalayan environment.
The visualization included black carbon, PM₂.₅, NOₓ, SO₂, CO, burned carbon and CO₂. The burned-carbon classes displayed in the image range approximately from below 115 tonnes to 2,000 tonnes or more, while the mapped CO₂ classes range from below approximately 400 tonnes to 5,000 tonnes or more in the highest category. These are spatial classes displayed in the dataset—not Nepal’s total national emissions.
What makes the image important is not simply the presence of carbon. It is the environmental pathway it represents:
Automobiles + industries + energy and biomass combustion → atmospheric carbon and pollutants → regional atmospheric transport → climate forcing and environmental change → snow and glacier impacts → changing mountain and river conditions → increasing downstream vulnerability.
For a sensitive Himalayan river such as the Bhotekoshi, changes occurring thousands of metres above communities can be transmitted downstream extraordinarily quickly.
Among the pollutants displayed, black carbon deserves particular attention because it can physically alter the snow and glacier environment. Once deposited on snow or ice, black carbon darkens the surface, reduces its reflectivity—or albedo—and increases the amount of solar energy absorbed. This can accelerate melting.
The mechanism is straightforward:
Black carbon → snow/ice deposition → lower albedo → greater solar-energy absorption → accelerated melting.
Black carbon therefore does not remain simply an urban air-pollution problem. Atmospheric particles originating from transportation, industries and combustion can be transported regionally and interact with sensitive Himalayan snow and glacier surfaces.
This does not mean that black carbon directly caused the Rasuwa–Bhotekoshi catastrophe. Nor can a percentage of glacier melting measured in one scientific study be converted into a percentage contribution to this disaster. The event involved a complex high-mountain process requiring event-specific scientific attribution.
What we can say is that black carbon is capable of measurably altering the Himalayan environment and accelerating snow and glacier melt, while CO₂-driven global warming is simultaneously changing the larger climatic conditions in which glaciers exist.
Figure 2. A Planet Experiencing Exceptional Warmth — 2023–2025
Anomalies and extremes in global surface air temperature during 2023–2025. Data: ERA5, reference period 1991–2020. Credit: Copernicus Climate Change Service (C3S)/ECMWF.
The second spatial image provides the global context without requiring a complicated explanation. The Copernicus maps show widespread unusually warm conditions across the planet during 2023, 2024 and 2025. This matters because Himalayan glaciers are not changing in isolation—they are responding to a global climate system that has experienced exceptional recent warmth.
The message is simple:
CO₂ accumulation → global warming → increasing thermal pressure on snow, glaciers and permafrost.
Black carbon can then add another regional influence by changing the amount of solar energy absorbed by contaminated snow and ice.
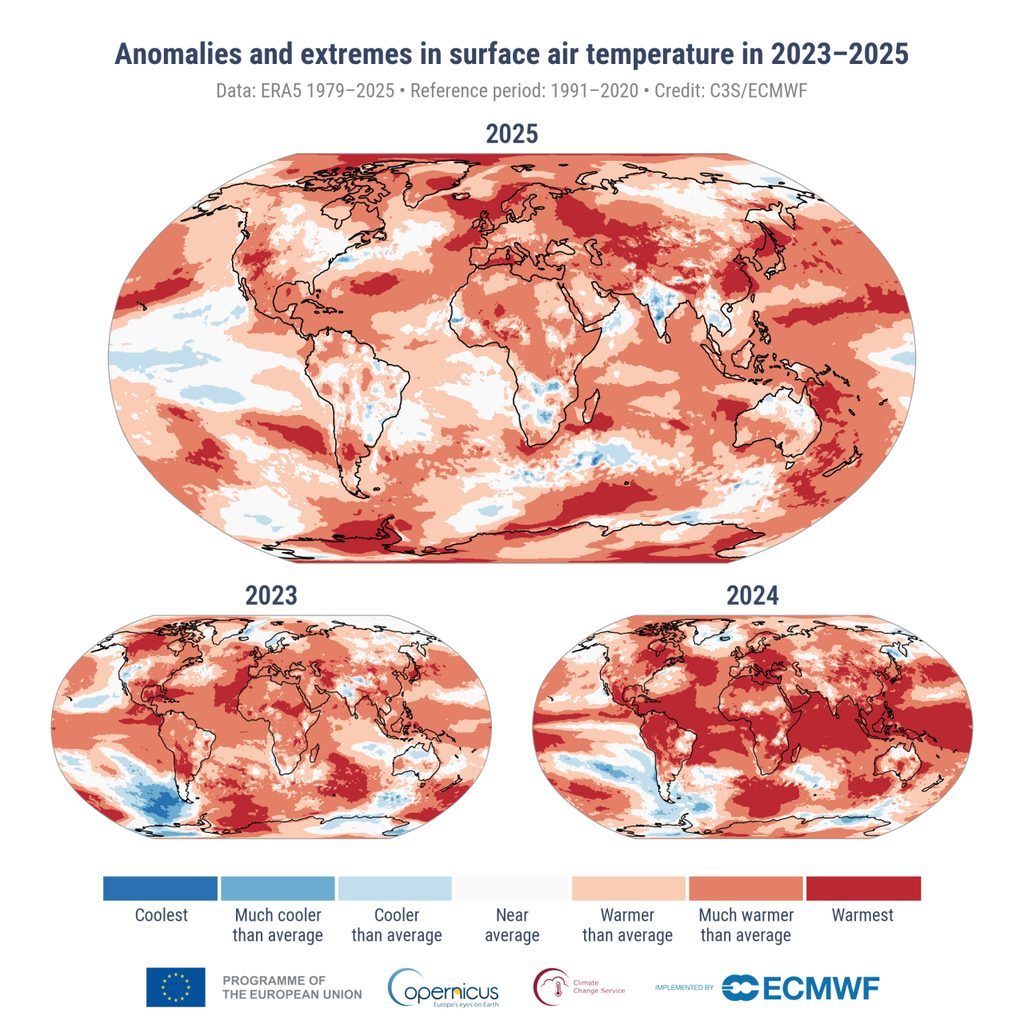
Figure 3. Precipitation Anomaly Across Nepal and South Asia — June–August 2026
Seasonal precipitation-anomaly outlook issued 15 May 2026 for June–August 2026, expressed in mm/day relative to the 1993–2016 reference period. Source: APEC Climate Center (APCC), 2026.
The third image shows another important signal: precipitation variability. The seasonal forecast indicated negative rainfall anomalies across considerable parts of Nepal and northern South Asia. This should not be interpreted as a prediction that catastrophic flooding could not occur.
“The question is whether we can connect science with prediction, prediction with policy, and policy with action before the next warning becomes another catastrophe.”
A three-month rainfall average cannot predict an intense event occurring within hours, and a high-Himalayan catastrophe may involve much more than rainfall alone. Glacier instability, snow and ice conditions, permafrost, rock slopes, river blockage and sudden movement of water and debris can all become part of the hazard.
That is why rainfall forecasting alone is no longer sufficient for Himalayan flood-risk assessment.
We need to connect:
Temperature + precipitation + glacier movement + snow cover + glacial lakes + slope instability + river discharge + atmospheric conditions + satellite observations.
The three images therefore should not be interpreted independently. The 2024 image shows atmospheric carbon and pollution pressures. The 2023–2025 temperature image shows the background of exceptional global warming. The 2026 precipitation image shows the complexity and spatial variability of Himalayan hydrology.
Together, they raise a much larger question about monitoring.
Following my postgraduate studies at Tsinghua University, I began working on climate-change mitigation and environmental strategies approximately eight years ago. Through collaborative work with UNDP, ICIMOD and other international and development organizations, I have worked to connect environmental monitoring and climate mitigation with practical field interventions and policy discussions. These observations, including the environmental monitoring represented here, have also been raised at the policy level.
My experience has increasingly led me to one conclusion:
Today the Rasuwa–Bhotekoshi catastrophe has made climate vulnerability visible in the most painful possible way. But some environmental impacts remain largely invisible. Black carbon, PM₂.₅ and other pollutants affect human health every day, while climate and atmospheric changes are simultaneously placing pressure on agriculture and food systems.
The environmental pathway therefore extends beyond glaciers:
Atmosphere → Climate → Glacier and Snow → Bhotekoshi and other rivers → Water → Soil → Crops → Food → Human Health.
This is fundamentally a global challenge. Nepal cannot stop global warming by itself. Carbon emissions accumulate globally; atmospheric pollution crosses political borders; and Himalayan glaciers, weather systems and rivers do not recognize national boundaries.
But Nepal can act.
We can strengthen high-altitude environmental monitoring, glacier and glacial-lake surveillance, river sensors, satellite change detection, early-warning systems and Nepal–China transboundary information exchange. We can reduce controllable black-carbon emissions from transportation, inefficient combustion and industries. Above all, we can begin integrating datasets that are currently examined separately.
The direction must become:
Observe → Monitor → Integrate → Assess Risk → Predict → Share → Warn → Act.
The 2024 carbon map did not predict the Rasuwa catastrophe. Neither did the global temperature map nor the seasonal precipitation outlook. That is not the argument.
The warning was already there because the broader environmental system was showing measurable change before its consequences became catastrophic.
Today, more than 800 people are confirmed dead across Nepal and China, and more than 3,000 remain missing based on the latest available figures. That human cost should transform the way we think about environmental monitoring.
We already have satellites. We have climate models. We have spatial data. We have international scientific discussions. The question is whether we can connect science with prediction, prediction with policy, and policy with action before the next warning becomes another catastrophe.